Making measurements on images
This lesson was adapted from the Matlab Image segmentation tutorial which can be found here: http://www.mathworks.com/matlabcentral/fileexchange/25157-image-segmentation-tutorial?s_eid=PSM_gen
The challenge files for this part of the course can be found here. The images were obtained from here- http://spc.ucsd.edu/#!
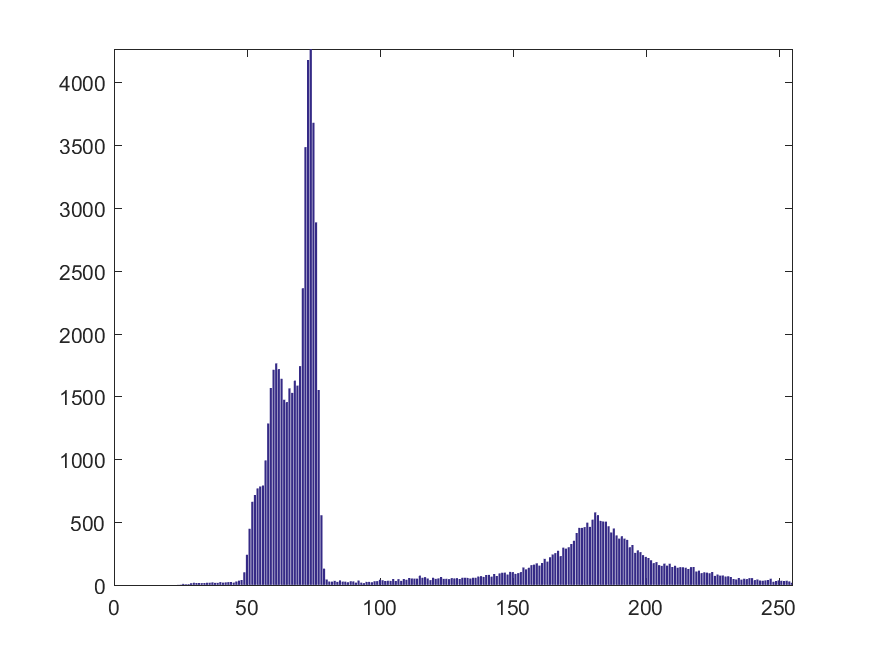
Display the histogram of the image.
coins= imread('coins.png');% load in coins.pngWe are going to do this by making a histogram. We will use the imhist function that comes with the image processing toolbox. Note: You can also use the inbuilt hist function.
[pixelcount, grayLevels]= imhist(coins); % pixelcount contains the intensity counts grayLevels contain the xaxis
figure
bar(pixelcount)

% Manually setting the x and the y limits
xlim([0 max(grayLevels)]);
ylim([0 max(pixelcount(:))]);
Challenge 1
Display the intensity of pixel histogram for the image file - plankton
% Read in the plankton image
% Get the histogram data and the grayscale data
% display the histogram
Converting image to binary
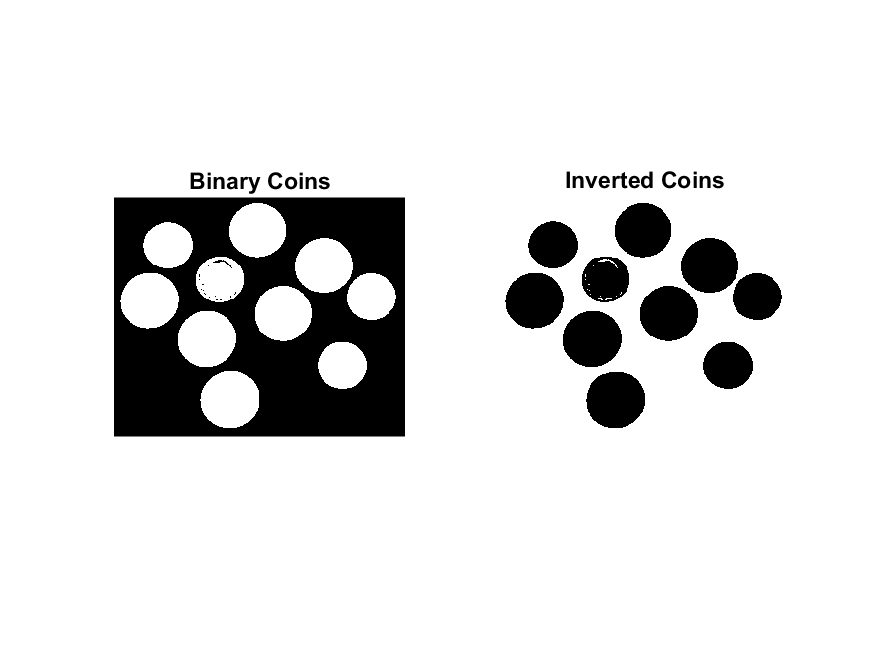
Look through the histogram to set a threshold. It looks like there are two clear peaks, one for all the darker values and one for the larger values. We can convert an image to binary using many methods. The simplest way of doing this is by using conditionals.
Threshold= 100; % Set a threshold.
binary_coins= coins> Threshold; % In the variable binary_coins, all the
% values in coins greater than the threshold will be made 1. Everything
% else will be made 0.
We can invert the image using ~. This will make the ones=zero and zeros=ones.
binary_coins_inverted= ~binary_coins; % invert the array

subplot(1,2,1) % plotting the two images side by side.
imshow(binary_coins)

subplot(1,2,2)
imshow(binary_coins_inverted)
Challenge 2
Set a threshold and convert the plankton into binary image.
% Define the threshold for the plankton image
% Use conditional formatting to convert to binary
Filling in the gaps in our image.
Since our object is to identify objects in our image, we have to make sure that the objects are uniform.
fill_coins= imfill(binary_coins, 'holes'); % If we leave out 'holes', then imfill opens
% an interactive interface where we can specify which gaps to fill.
figure; imshow(fill_coins);
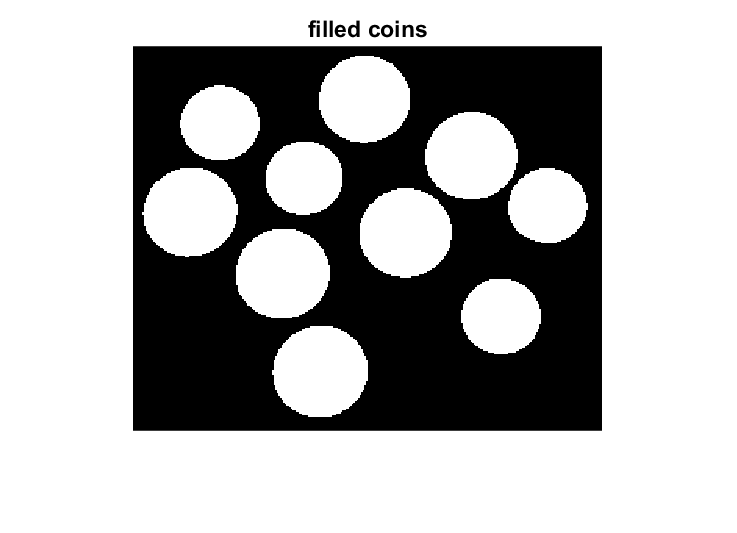 We can see that the gaps have now been filled in.
Challenge 3
Use imfill to fill in the gaps in the binary image of the plankton
Finding and labelling connected objects
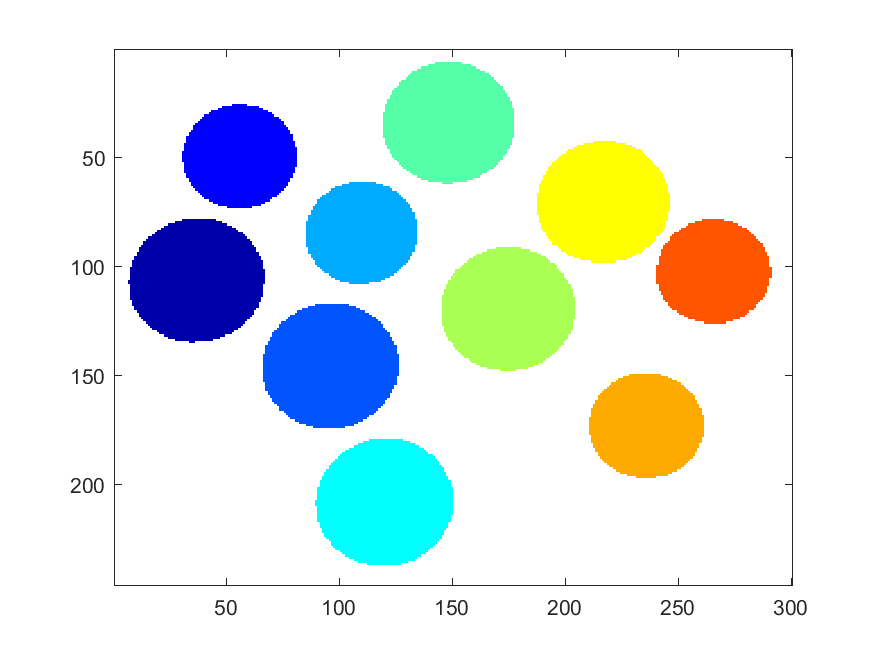
We can use the bwlabel function to give each of the objects in an image a a unique identitiy.
[labeled_coins, count]=bwlabel(fill_coins);%label the different elements
rgb_labeledcoins=label2rgb(labeled_coins);%convert labeled image to rgb
imagesc(rgb_labeledcoins);%display labeled image
impixelinfo% get pixel information.
imagesc(labeled_coins); colormap gray % display the same image in gray scale
impixelinfo %get pixel information.
If we hover over each of the coins, they will have a number corresponding to their label. We can isolate each of the objects once again using our best friends: conditionals. We can display only one of the coins.
coin_1= labeled_coins==1;%select just the coin labelled 1.
imagesc(coin_1); colormap gray; %display the single coin
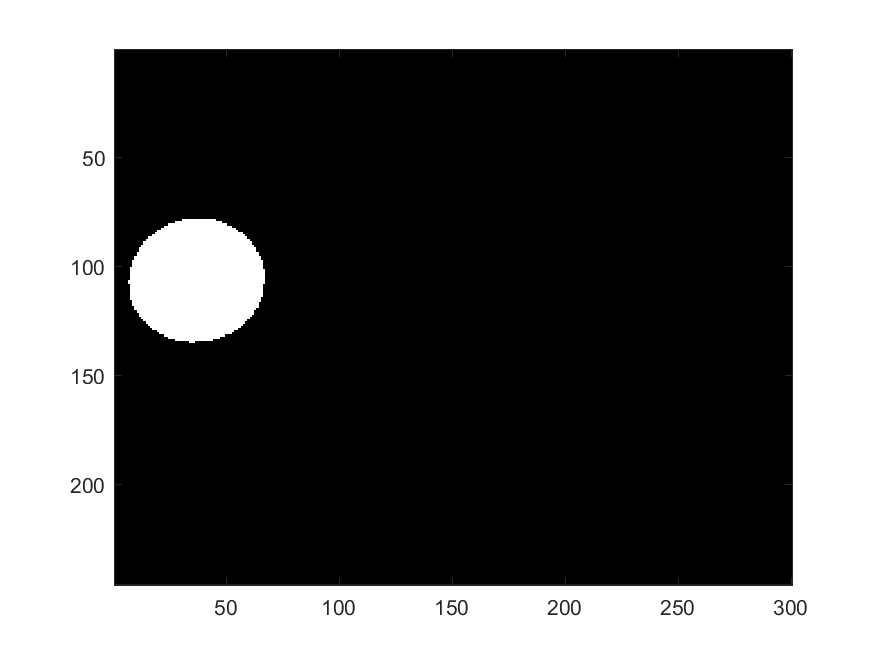
We can get all the individual coins as separate element of a structural array
connected_coins= bwconncomp(fill_coins, 8) % Don't suppress output
connected_coins.PixelIdxList;
We can see that each of the coins are a separate cell in the structural array connected_coins.PixelIdxList.
Challenge 4
Find all the connected objects in the filled plankton image.
Making Measurements
The image processing tool box conveniently has the regionprops function to calculate some basic properties of the objects of the image.
measurements= regionprops(connected_coins, coins, 'all'); % use region props- uses each of the objects in connected_coins to find all the properties from the original grayscale image coins.
% can get tthe measurements of individual objects
% for coin #1
coin1= [measurements(1). MeanIntensity, measurements(1).MaxIntensity, measurements(1).MinIntensity];
% similarly for coint 2
coin2= [measurements(2). MeanIntensity, measurements(2).MaxIntensity, measurements(2).MinIntensity];
Challenge 5
Find the long axis and the short axis of the plankton.
Master Challenge.
Solve the challenge in the World_of_planktons.m file from the plankton challenge repository.
%% The world of planktons!

% Hello! I am a botanist who is really interested in planktons. A part of
% my research involves classifying different kinds of planktons. If you
% have ever researched planktons, you would know that the sheer number of
% them is exciting but also overwhelming. Unfortunately I am feeling more
% overwhelmed than excited at the moment. We find hundreds of new planktons
% everymonth and it's getting harder to characterise them by hand and my
% ruler. I hear you are good with the computer. Could you help me pleasee?

%% They say the first step is to read in the image and look at the image information. Can you help me do this please?

% Read in the plankton image
planktons= ;

% Display the image

% Display image information


%% Ooh aren't they pretty?! So colourful. I hope the colours are not too much of an issue. You are such a programming expert though! I am sure you  will be able to solve any problems!

% Convert image to grayscale.
planktons_gray= ;

% Look at the histogram of the intensity of the pixels and set a threshold.
[count, graylevels]= ;

% Display histogram


% Set a threshold and make the image binary

threshold= ; % setting a threshold

planktons_binary=; % Use conditional vector to make image binary

% Display the binary image


% Oops there seem to holes in the binary image. Could you fill these in
% please?

planktons_fill=; % Fill in the gaps.

% Display the filled image.


%% Oops the borders of the planktons are separate from the planktons :O!
% This part was not covered in the course. We can use morphological
% operators to open or close images. Opening images makes the small bridges
% between operators disappear whereas closing an image makes these areas
% more prominent. You can find some useful information on morphological operators
% here: https://www.cs.auckland.ac.nz/courses/compsci773s1c/lectures/ImageProcessing-html/topic4.htm
% Their usage in Matlab can be found here: http://au.mathworks.com/help/images/morphological-filtering.html?searchHighlight=Morphological%20operators

se= strel('disk', 5); % Create a structural element of an appropriate size
plankton_open= imopen(plankton_fill, se); % Open up the image
imshow(plankton_open); % Display the opened image

%% Now we can count the number of planktons and measure their sizes!!!

% Find the connected components.

connected_planktons= ;

% How many planktons are in my sample?
 Number_of_planktons=;

% Measuring the planktons.
 measurements=;

 % Oh thank you! I could not have done this without you!
 % You are incredible. As a thank you, you can name a plankton
 % of your choice. Make sure you crop it and tweet it
 % @resplat!
 % Also don't forget the credit our organisation-http://spc.ucsd.edu/#!
 % You have just helped us do some measurements on the planktons we found
 % in the month of May!