Getting Images into MATLAB
Objectives
- Read in images
- Write images to file.
- A good understanding of colormaps and how to assign them to an image.
- Know the different data types used in Matlab.
- Be able to change from one data type to another.
Reading in images.
We will use the imread function to read in images.
 %% Load in and show the image
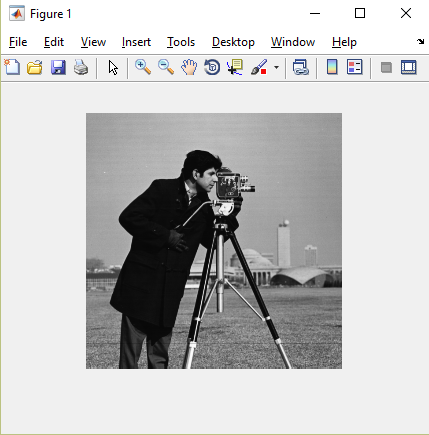
  cameraman=imread ('cameraman.tif'); % reading the image in
  figure
  imshow(cameraman); % imshow

imshow is a good function to use but we can also use our basic image and imagesc functions. We will use these a little bit later in the course.
Getting image information
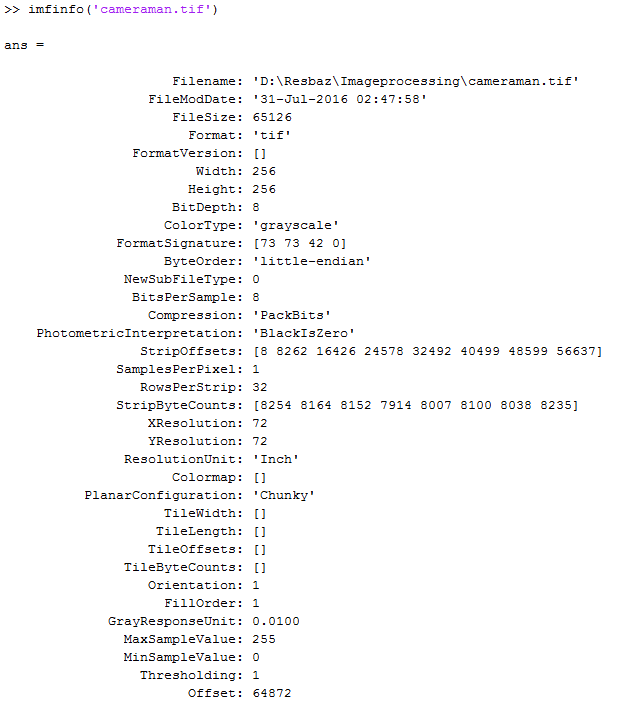
We can look at the metadata of an image by using the imfinfo function.
imfinfo('cameraman.tif') 
Look at width- this should equal the number of columns. Look at height- This should equal the number of rows Color type= grayscale. Bit Depth= 8. Color type and bitdepth indicate that the image is a bunch of intensity values that is in 256 steps (0 to 255). </code></pre>
Let's look at another image. This time the image is called 'peppers.png'
% Read in the autumn.tif file supplied with the image processing toolbox.
autumn= imread('autumn.tif');
% Getting image information.
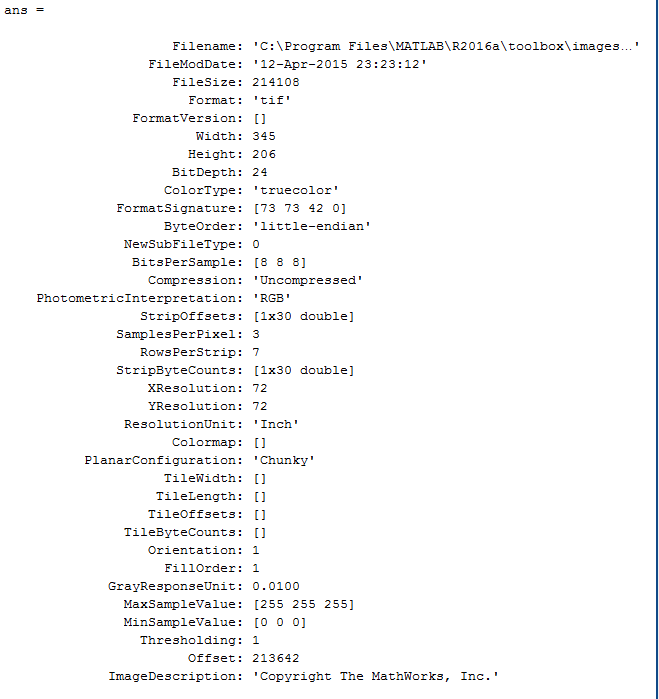
imfinfo('autumn.tif');

Look at width, height. In the workspace, look at the variable 'autumn'. Colortype is 'truecolor'. Photometric Interpretation- 'RGB'-- this is a colour space. If you look at the variable 'autumn' in your workspace, then you can see that there is row x column x 3.
% autumn(:,:,1)= red intensity values
% autumn(:,:,2)= green intensity values
% autumn(:,:,3)= blue intensity values
Colormaps
The colour information for an image is stored under a colormap. Let's look at the colormap of cameraman.
close % close open figures
imshow(cameraman) % display the autumn image
cmap= colormap; % get the colormap of autumn
The output of cmap has the dimensions 256 x 3. The columns are r,g and b co-ordinates respectively. The values are between 0 and 1 and indicate the proportion of r,g and b for a color in the image. Because cameraman is a grayscale image, these values will be the same for all three columns.
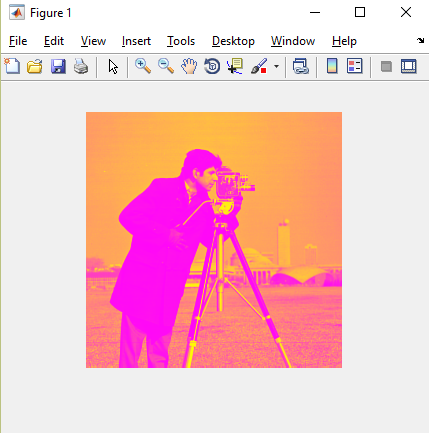
We can also set a particular colormap for the image. Let's set cameraman the colormap 'spring'.
colormap(spring)
Challenge 1
Converting colour types.
Matlab has inbuilt commands to convert between colour types. Here is a list of colortypes you can convert between.
rgb2gray
gray2ind
ind2rgb
For the first part of this challenge, convert autumn.tif to a grayscale image. Use imshow to display the image. Hint: you need to read in the image and then convert the matrix.
Now convert the grayscale image cameraman.tif to rgb. Use imshow to display the image. Is it a colour image now? Why or why not?
Extension
Look at the other two colour types in Matlab: binary and indexed colour. We will look at binary later in the course but try to figure out what indexed colour means.
Saving images in Matlab
As with other tasks we perform in Matlab, we can write an image to file in different ways. We can use the same functions we used to save plots/ figures. In later versions of Matlab, there is a generic saveas function that comes in very handy! This is how you do it.
% Save cameraman to image
imshow(cameraman) % to save using the saveas function, you need to display the image. Alternately, you can assign the figure a handle like so.
h= imshow(cameraman); % assign the figure handle to h.
saveas(gcf, 'cameraman.tif'); % or,saveas(h, 'cameraman.tif')
The figure handle stores a value for the figure which it can then call. The function gcf automatically calls the current figure.
The image we've saved this way, as you can see is not ideal. It has these white edges around it and is distorted, depending on the way we display it. An alternate way to write an image to file is the Image Processing toolbox function imwrite. This function uses the original array as its input and as result is not affected by display parameters.
imwrite(cameraman, 'cameraman_resave.tif');
Challenge 2:
Look at the help documentation for colormap. Try changing the colormap of cameraman to a different colormap of your choice.
Can you make your colormap and assign it to cameraman?
Save the image to file using imwrite.
Data Types
The values in autumn are also of the type uint8- This means that it is populated by 8-bit integer values (0-255). Matlab's default data type is 'double'. This is double precision point numbers. Values are usually between 0 and 1. We can convert between data types.
cameraman_double= double(cameraman);
Let us now look at the variables cameraman_double and cameraman. Only difference seems to be that the cameraman variable now seems to have the type double. The values in the variables seem the same. What happens if we try to show the image in cameraman_double?
imshow(cameraman_double) This is a blank image. We can look at the scale of the image by clicking on the color axis button. Because cameraman_double is of type double, the imshow expects values between 0 and 1 but all our values are over 1. So the image saturates. To display cameraman_double, we need to convert the values so that they are between 0 and 1.
figure
imshow(cameraman_double/256);
Challenge 3:
For this course, we will be using the following dataypes: double, uint8,struct and logical. Look at the help documentation for datatypes and look at the above mentioned data types.